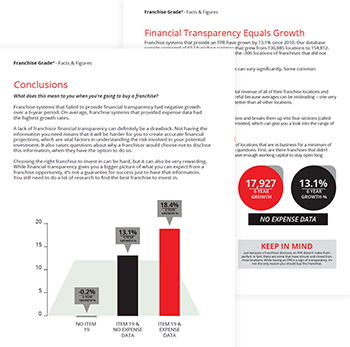
Financial Transparency Delivers
2016 Facts & Figures Report Published on November 22, 2016Share Tweet Share
 It’s that simple. Passion for the brand is great, but passion doesn’t put money in your pocket.
The importance of knowing how much money you can make when you’re buying a franchise can’t be overstated. Having accurate and detailed sales and expense data makes it easier to understand the benefit of buying a franchise. Expense data enables you to construct a more accurate pro forma income statement and cash flow projection to make sure the investment is healthy. As part of our research into franchisee investment risk, we grade Financial Transparency. Those franchise systems with expense data receive an A or A+ for the Financial Transparency grade.
Franchisors aren’t required to disclose financial information about their franchisees. This information is referred to as a Financial Performance Representation (FPR), and is done in Item 19 of the Franchise Disclosure Document. Because this information isn’t mandatory, some franchise systems don’t provide any financial data, which should raise some serious red flags for potential investors.
After all, if franchisees are making money, why wouldn’t the franchisor want to tell you about it?
When crunching numbers in our database, we found a relationship between a strong FPR and successful franchise systems. The following Facts & Figures reveal the results of our analysis on the growth of 1905 franchise systems over a 6-year period, based on financial transparency within Item 19 disclosure.
Not sure how much can you afford?
Fill out our Franchise Affordability Calculator


Voyage Franchising
Related Articles
A Study of Ongoing Fees Between 2013 and 2016
We have completed a study on the changes in Ongoing Fees in the franchise industry using our data from 2013 – 2016 to publish the report.
The Franchise Disclosure Document Shouldn’t be a Secret
A Franchise Disclosure Document (“FDD”) presents key components of the franchise program including the obligations of the franchisor and franchisees.
The Complication of Buildouts in FDDs
As franchise system development becomes more competitive franchise systems are employing a new strategy to grow their brand and increase franchise sales.
Historical Trends of Key Franchise System Metrics
The composition of the franchise investment differs in key areas such as: franchise fees, royalty rates, territory protections and Item 19 disclosures.
Maximize the Power of Data to Sell More Franchises
Data has become essential to having a successful franchise development team. Those that maximize the power of data will sell more franchises.
Item 20 Errors Reflects on Franchisor Performance
When reviewing an FDD, we always keep our eyes out for any errors. The error that is the most troublesome for us is when we see Item 20 errors.


