For millions of Americans, franchising is an economic engine that generates wealth and prosperity. In the last nine years, entrepreneurs have invested over $459 billion dollars, opening over 350,000 new franchised outlets. An increased ease in lending opportunities including SBA fast-tracked franchises and 401(k) rollovers have helped spur first-time business ownership opportunities for middle-aged and senior investors looking for career change.
Our database of over 3,000 franchise systems represents more than 500,000 locations throughout the nation, each of which provide jobs, resources, and success for stakeholders and employees. The franchise model appeals to a wide variety of business operations, ranging from large companies in downtown urban centers to the local mom and pop franchisee in rural America.
Franchising isn’t unfamiliar, but in many cases it’s unrecognized. Most Americans could name several franchises like McDonalds or Subway, but it may not be obvious that franchising is more than just fast-food chains. Beyond the most familiar brands, franchised businesses provide Americans with everyday services like lawn care or day care. Franchises are the gyms, spas and senior care companies making it easier to manage your health. Franchises are the automotive repair shops, the sign and printing shops or doggy day cares, helping you get things done.
The opportunity to invest in a franchise enables everyday Americans to live their entrepreneurial dream. There are several reasons why opening a franchise is a better alternative than starting your own business from the ground up. A franchise is meant to provide you with a proven concept, training and support, and of course brand popularity and marketing. In other words, a franchise is supposed to give you a running start on your business operations, that helps you become successful faster than if you started the business from scratch.
But franchising isn’t always what it appears to be. For a percentage of franchise systems – even the most recognizable — there’s a constant struggle between franchisors and franchisees. Every now and then a relationship dispute will make the news, such as recent concerns made public by the Jack in the Box Franchisee Association.
Numbers Tell the Truth

As part of our research at Franchise Grade, we collect yearly data on all franchise systems within the United States, including Franchise Disclosure Documents (FDDs). FDDs are required by the Federal Trade Commission and are created by franchisors and their attorneys. Within these documents, franchisors disclose information related to their investment opportunity, such as upfront fees, ongoing royalties and estimated initial investment costs, as well as territory rights and initial term length of an agreement.
Franchisors are also required to disclose three years of outlet activity, including the number of franchised outlets that opened each year, as well as outlets that transferred, not renewed, reacquired, terminated and ceased operations.
You might remember our 2015 Facts and Figures Report titled A Few Bad Apples, where we highlighted some interesting findings about the health of the franchise industry. Four years later, revisiting the same statistics shows that while the franchise industry is doing relatively well, little has changed from when we began researching FDDs over a decade ago.
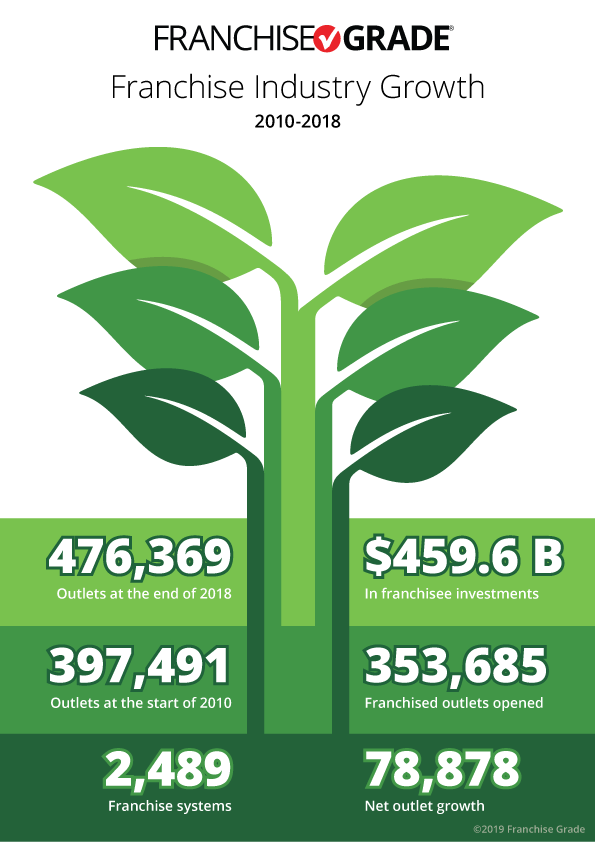
The 2,489 franchises in our index (with continuous FDD data) have grown from 397,491 outlets at the start of 2010 to 476,369 outlets at the end of 2018.
Here are some key statistics from our research. Since 2010:
- $459.6 billion in franchisee investments
- 353,685 franchised outlets opened
- 78,878 net outlet growth
This data is compiled from Item 7: Estimated Initial Investment and Item 20: Outlets and Franchisee Information, for each FDD year. Overall, franchise outlet growth is strong, increasing by 19.8% over the last nine years — an average of 2.2% per year. Better still, the last four years have seen an average growth rate of 2.8%. But franchise outlet growth isn’t the end of the story.
Exploring the data a step further, the differences in net growth statistics across the industry offer a unique narrative. Net growth, which is calculated by the percentage of new outlets opened divided by the number of outlets closed, is information that’s provided by franchisors directly within Item 20 (Table 3) of their yearly FDD. Two franchise systems with similar growth rates can have conflicting net growth rates. Ultimately, net growth is more important than growth.
A lack of analysis of net growth rates creates unforeseen risk for potential franchisees. Although this risk isn’t typically identified or raised as a concern, it impacts the overall success and reputation of the franchise industry across every sector.
The Importance of Net Growth
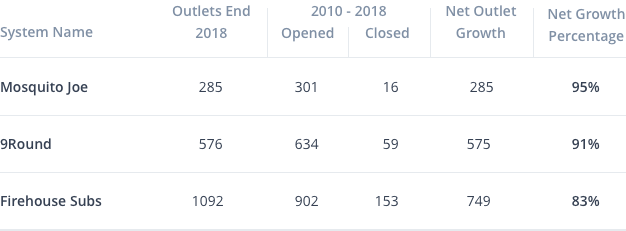
Of the franchises in our index, 654 of them have a net growth rate above 80%. That means franchisee turnover is minimal, and the new outlets that are being opened are contributing to positive outlet growth. Three examples are 9Round, Mosquito Joe and Firehouse Subs. These three franchises are nothing alike, ranging from under $100,000 to over $1,000,000 initial investment costs. One is a fitness concept, the second is pest control and the third is a sub shop. But, one thing they have in common is they’ve each been able to outpace industry averages and closed a limited number of outlets over the last nine years.

Take It With a Grain of Salt
217 of the franchises in our index have a net growth rate between 0-30%, which means they’re closing existing outlets at almost the same pace as they’re opening new ones. Matco Tools, Kumon and Subway are all very different franchises ranging from a mobile home-based business and a children’s educational franchise to one of the most iconic franchise brands of all time. All three have significant sales activity and have opened a lot of new outlets in the last nine years but demonstrated only a slightly positive net growth. These franchises may appear to be successful, and to a certain extent they are, but the franchise systems’ success has several individual franchisees who have closed and lost their investments for that to happen.

Franchisors: Try to Stay Positive
A prominent chunk of the franchises in our index–665 to be exact–have a net growth below 0%, or negative growth. That means they’re actually closing more outlets than they’re opening. Signarama, Cold Stone Creamery and Long John Silver’s, for reference, are all in different sectors ranging from a print and graphics store, quick-service ice cream shop to a dine-in restaurant. All three franchises have negative outlet growth, but continue to sell and open new outlets each year.

Always Aim for the Net
On the surface, some franchise systems can appear to be more successful than they really are. For example, looking at most franchise brands that have a national presence based on their prominence (how frequently you see one of their outlets or how they’re portray themselves in media), at first glance you’d think they were solid from the top down.
Without looking at hard financial data, your perception of that franchise is skewed more by how popular their CEO is or how much you enjoy their product. But, the headaches and churning that can result from unforeseen problems or a lack of demand can cost individual franchisee investors their investments, despite all those positives.
It’s important to not get caught up in the consumer-driven mindset of franchise investing. The best advice would be to compare several franchise systems, just like you would a stock and look historically at the franchise system’s success and track record. It’s your money and your investment on the line, so look deeper than growth. Look at net growth as well.
Not sure how much can you afford?
Fill out our Franchise Affordability Calculator


Voyage Franchising

